Why and How to Handle Outliers

What are outliers?
An outlier is an extremely high or extremely low data points relative to the nearest data point and the rest of the neighboring co-existing values in a data.
Outliers are extreme values that stand out greatly from the overall pattern of values in a dataset.
Formal Definition:
Outlier is an observation that appears far away and diverges from an overall pattern in a sample. Outliers in input data can skew and mislead the training process of machine learning algorithms resulting in longer training times, less accurate models and ultimately poorer results.

Example: If in your class there are 100 students and 99 students got the average mask of 52% and there is 1 student who got 99.9% on the test so that 1 student(with 99%) is the outlier because of him the average mask of whole class will become higher but that’s not the true representation of your class average.
Reasons For Outliers present in the data:
Data entry errors (human errors)
· Measurement errors (instrument errors)
· Experimental errors (data extraction or experiment planning/executing errors)
· Intentional (dummy outliers made to test detection methods)
· Data processing errors (data manipulation errors)
· Sampling errors (extracting or mixing data from wrong or various sources)
· Natural (not an error, novelties in data)
When is Outliers Dangerous?
This is an interesting question because sometimes outliers can be useful like in Anomaly Detection Algorithms. Where you need Outliers to detect some of the suspicious staffs going on.
Example: If you want to find if there is something suspicious going on in a credit card transaction you have to create a model which has outliers because that suspicious credit card transaction will be a little different than the normal transaction, And in this case, you have to keep the outliers in the dataset as those your model will be dependent on those outliers to catch suspicious transaction.
The most disturbing part of the Outliers is it is easy to find outliers in your dataset but it is difficult to know what to do with those outliers you can keep those outliers, you can remove them or you can change that outliers value into something that is related to your data. So you have to be very careful while handling Outliers.
Effects of Outliers in Machine Learning Algorithms?
There are some sets of algorithms where you have to be very careful with Outliers like Linear Regression, Logistic Regression, AdaBoost, and Deep Learning. And the common pattern in this algorithm is you have to calculate weights.
So if you want to know if the outliers will impact the model then you have to check if that algorithm is a weight-based algorithm.
There are algorithms like tree-based (decision tree, random forest, etc) where there is not much impact on the model than the weight-based algorithm discussed above.
How to treat Outliers?

Trimming
It means to remove the outliers from your data, But the problem with this approach is if there is so much amount of outliers and you remove it all then your data will become thin(data becomes less). The advantage of this process is it’s very fast just you have to remove the outliers.
Capping
The thing is to remember in this is your outlier will always be in the lowest or highest side of your data not in the middle, So the thing you can do here is put the limit on both sides (higher and lower side) lower than that limit are all outliers and higher then that limit are all outliers. And give all the outliers the limit value, lower outliers will get a lower limit value and upper outliers will get an upper limit value.
There are a few more treatment methods for outliers like treating your outliers as a missing value and then treating it accordingly. Or the other method is you do Discretization which means you take a numeric column and create a range of it, like if you have numbers from 1–100 and you can create a range like [1–10], [1–20], and so on and you can also name that range.
How to detect Outliers?
If you think there are outliers in your data so how will you know that there is outliers in your data, so there is basically 3 types to know the outliers.

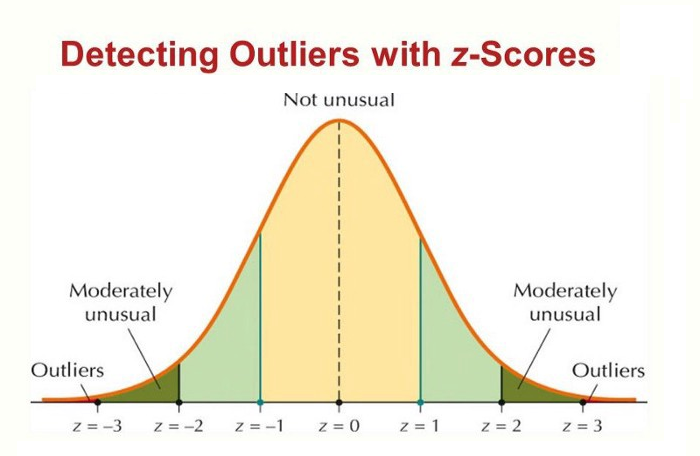
Normal Distribution
If your column in which you are working is normally distributed, then it is very simple because in between 1 standard deviation there is 68.2% information, in between 2 standard deviation there is 95.4%. and between 3 standard deviation there is 99.7% information. So if any data point is outside of (mean + 3 standard deviation) and (mean — 3 standard deviation), in that case you consider it as an outlier.

Skewed Distribution
If your column in which you are working is not normally distributed but is skewed in this case you use Interquartile Range(Basically a box plot)

Technique for Outliers Detection and Removal

Z-Score Technique
When using this technique it is assumed that the column in which you are working is Normally Distributed.
By using the above code you will get the lower and upper limit of your column and then you can decide if you want to remove your outliers or replace your outliers with your limit value.
IQR and Box-Plot Method
You use this method my the column of your data in which you are working is Skewed. To use this method you have to first know what is box plot and IQR. In the box -plot you have percentiles.

In this method, you have to find out the IQR and then find the upper and lower limit of the data. You can also visually see the outliers by plotting the box plot. I have written the code to find the limits and draw a box plot.
Percentile Treatment
This is a very simple technique in which you have to decide your own quartile, in this method you have to make sure that how much you left in the upper you should leave that same amount in the lower limit as well.
If you are leaving 1 percentile(which is the most appropriate to leave) in the upper limit so you have to leave 1 percentile in the lower limit also.
Conclusion
Throughout this exercise we saw how in data analysis phase one can encounter with some unusual data i.e outlier. We learned about techniques which can be used to detect and remove those outliers.
Follow Me
If you find the ideas I share with you interesting, please don’t hesitate to connect here on My Social Profile.